Introduction
In the ever-evolving world of cryptocurrency, technical analysis plays a pivotal role in forecasting market movements. Today, we take a closer look at Bitcoin Cash (BCH) and its recent performance against Bitcoin (BTC). According to CoinDesk analyst and Chartered Market Technician Omkar Godbole, BCH has demonstrated remarkable potential, breaking out of a significant triangle pattern. This article delves into the technical indicators and price projections that could shape the future of BCH as it aims for a bullish run against BTC.
Understanding the BCH/BTC Triangle Pattern
The BCH/BTC trading pair on Bitstamp has recently jumped out of a triangle pattern characterized by a series of descending intraday price highs and ascending price lows. This narrowing price range typically signals a breakout, and as history suggests, such breakouts often lead to significant price movements. With BCH on the verge of a potential bull run, traders and investors are keenly watching how this plays out.
As of now, the BCH/BTC ratio has already surpassed the crucial 200-day simple moving average (SMA), a long-term trend indicator that is closely monitored by both retail and institutional investors. This breakout could signify that BCH is poised for a strong upward trajectory against BTC.
Price Resistance Levels for BCH
While the outlook for BCH is predominantly bullish, potential resistance levels loom ahead. The first significant resistance is at 0.00467, where a swing low was recorded in February 2024. Following that, the December high of 0.00636 represents another critical barrier that BCH must overcome to maintain its bullish momentum. Traders should exercise caution, as the bullish scenario would be invalidated if the BCH/BTC ratio dips below the monthly low of 0.00373.
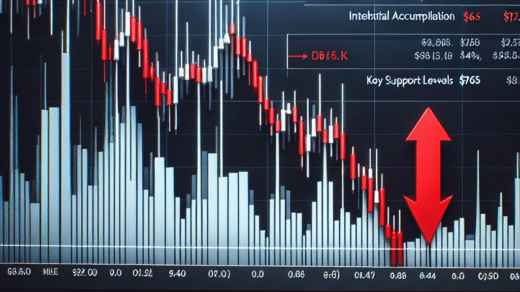
The HYPE Token: A Bearish Divergence?
In contrast to BCH’s bullish outlook, decentralized exchange Hyperliquid’s HYPE token appears to be facing challenges. After experiencing an impressive near five-fold rally to $44 over three months, HYPE’s recent price action indicates potential weakness. The daily price chart reveals a concerning trend: while HYPE has achieved higher intraday highs, the 14-day relative strength index (RSI) has shown a negative divergence, suggesting a weakening of upside momentum.
This bearish divergence is a pattern that often precedes trend reversals. Investors should remain vigilant, as it could signal a potential downturn for HYPE. Such market behavior warrants careful consideration, especially for those looking to invest or trade in the HYPE token.
Conclusion: What Lies Ahead for BCH and HYPE?
As we navigate through the dynamic landscape of cryptocurrencies, the breakout of BCH against BTC presents a fascinating opportunity for traders and investors alike. The potential for a bullish run remains strong, yet it is crucial to monitor resistance levels and adjust strategies accordingly.
Conversely, HYPE’s current trajectory raises concerns, and investors should be prepared for possible corrections. Market participants are encouraged to stay informed about technical indicators and market sentiment to make well-informed decisions in this volatile environment.
Stay Updated on Cryptocurrency Trends
For those interested in further exploring the world of cryptocurrencies, consider reading our guides on How to Buy Cryptocurrency, Bitcoin ETFs, and XRP Price Predictions. The cryptocurrency market is filled with opportunities, and staying updated is key to making profitable investment decisions.
Meta Description: “Discover the latest technical analysis on Bitcoin Cash (BCH) as it breaks out against Bitcoin (BTC) and explore the potential for a bullish rally. Learn about key resistance levels and the bearish divergence affecting HYPE token in this comprehensive cryptocurrency analysis.”