“`html
Daily Cryptocurrency Market Analysis: Bitcoin, XRP, Ether, and Solana
The cryptocurrency market is a dynamic environment, constantly influenced by trends and market signals. In today’s analysis, we explore the current state of Bitcoin (BTC), XRP, Ether (ETH), and Solana (SOL), focusing on key technical indicators and potential price movements. As we delve into these cryptocurrencies, we aim to provide insights that can guide traders and investors alike.
Bitcoin: Risks of a Deeper Pullback
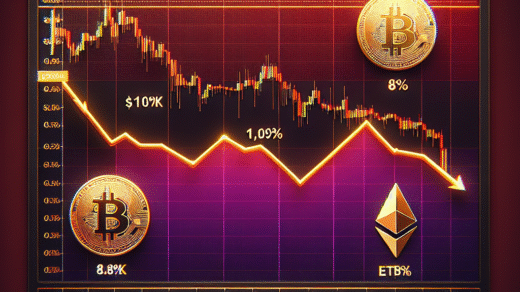
Bitcoin’s (BTC) recent multi-month rally appears to be encountering significant resistance, raising concerns about a potential deeper correction. The weekly candlestick chart reveals that Bitcoin bulls have struggled to maintain momentum above the macro trendline established during the 2017 and 2021 bull markets.
This failed breakout is compounded by a noticeable decline in momentum indicators. The MACD histogram, although still in positive territory, has dropped significantly from its peak in December 2024. Adding to the bearish sentiment is the 14-week Relative Strength Index (RSI), which has broken its upward trend line from the March lows, continuing to print a series of lower highs since March 2024.
On a shorter timeframe, the shift in momentum is even more pronounced. The three-line break chart—a tool that filters out minor market noise—has produced three consecutive red bars, signaling a classic bearish reversal. This combination of signals indicates that Bitcoin may be poised for a deeper correction, potentially testing immediate support at $11,965, the former high from May, with the next significant level at $100,000.
To invalidate the bearish setup, Bitcoin prices would need to break above the resistance levels at $120,000, $122,056, and $123,181. Immediate support levels are found at $111,965, $112,301 (50-day SMA), and $100,000.
XRP: Challenging the Downtrend Line
XRP (XRP) is currently making attempts to break out of its downtrend line, which has defined its recent corrective phase. While there has been a modest bounce in the price, the rally is constrained by the 38.2% Fibonacci retracement level, which is acting as a crucial resistance point.
The prevailing bearish backdrop is underscored by the 5- and 10-day simple moving averages (SMAs), which continue to trend downwards. Furthermore, the 50-, 100-, and 200-hour SMAs are in a bearish configuration, indicating a strong downtrend. For XRP to regain bullish momentum, it would need to close above $3.00, shifting the focus to the previous lower high of $3.33 recorded on July 28.
Resistance levels to watch include $3.33, $3.65, and $4.00, while key support levels are at $2.72, $2.65, and $2.58. For more insights on XRP, check out our detailed analysis on What is XRP and XRP Price Prediction.
Ether: Bearish Outside Week Signals
Ether (ETH) has experienced a significant decline of nearly 10% over the past week, forming a large bearish outside week candle that signals a potential change in market control. This bearish sentiment is reinforced by the daily candlestick chart, where the 5- and 10-day SMAs have executed a bearish crossover, indicating a break in the short-term uptrend.
Although Ether has witnessed a slight bounce since Sunday, the strength of this rebound is questionable. The daily three-line break chart has printed two consecutive red bricks, confirming a reversal to the downside. This combination of long-term and short-term indicators suggests that Ether’s path of least resistance is now lower, with resistance levels at $3,941, $4,000, and $4,100, and support levels at $3,355, $3,000, and $2,879.
Solana: A Potential Golden Cross Ahead
Solana’s (SOL) recent pullback is undergoing a critical test, as bulls have managed to defend a significant support level over the past 24 hours. The price has bounced off the 61.8% Fibonacci retracement level, often regarded by traders as a strong price floor during an uptrend.
Looking ahead, a major long-term signal is on the horizon with the impending “golden cross” of the 50- and 200-day SMAs. While this is a lagging indicator, a successful cross would signal a powerful long-term bullish trend, indicating a potential shift in market momentum.
However, traders should remain cautious as the short-term trend remains bearish, with the 5- and 10-day SMAs continuing to trend downward. Key resistance levels to monitor are $175, $187, and $200, while support remains at $156, $145, and $126. For those interested in investing in Solana, our guide on How to Buy Solana provides valuable insights.
In conclusion, the cryptocurrency market is experiencing a phase of volatility, with Bitcoin potentially facing a deeper correction, XRP battling a downtrend, Ether showing bearish signals, and Solana on the brink of a bullish cross. As always, investors should conduct thorough research and consider both short-term and long-term perspectives when navigating this fast-paced market.
“`
Meta Description: “Explore the latest cryptocurrency analysis as Bitcoin risks a deeper slide to $100K, while XRP battles a corrective trend. Dive into market insights for Ether and Solana. Stay informed with our expert analysis on BTC, XRP, ETH, and SOL.”


